Analytics is an important component of successful business management. Based on data, it helps understand the market, identify trends, make informed strategic decisions, find growth points, and manage risks.
With the help of analytics, it is possible to assess the real current state of the sharing business. Together with the ScootAPI marketer, we delve into why analytics is essential for kicksharing, what metrics are crucial to track in the first place, and how to use this data for successful management and scaling of your business.
Why businesses need analytics
The main role of analytics is to help any business act not on intuition and feelings but based on real facts and figures.
The goals of analytics include:
- Understand the current stage of business development.
- identify “bottlenecks” — the company’s weak points that limit its growth.
- Find ways to scale, as analytics allows forecasting based on current data.
- Explore the correlation of numbers to understand how to influence a particular indicator through a dependent metric.
It is important to understand that there is no universal analytics system; each company builds it according to its own specifics. Analytics in different niches differs only in terms of what metrics to analyze and what correlations to build between them. Let’s delve into the specifics of analytics for the kicksharing business and see around which indicators it is built.

Analytics system in kicksharing business
To build an analytics system, to understand which metrics to count and in which directions to develop, first of all, you need to look at which objects (units) your business is built around.
Having launched over 15 carsharing projects worldwide, we at ScootAPI can identify three main units of the economy in carsharing:
- Users
- Devices (electric scooters)
- Trips
Based on the main units, you can build the skeleton of an analytics system. In the kicksharing business, it should include the following sections:
- Payment — all about payment and finances
- Users — all data about users
- Trips — all about trips
- Vehicles: all about the condition of devices
Next, let’s break down each group of metrics and the key indicators that should be tracked for successful management and scaling of your business.
Payment metrics
First of all, everyone considers the company’s profit, and here it is important not to forget about the specifics of the sharing business. Most often, in this niche, companies operate on a system when users first top up their wallet, and then spend money on trips. Therefore, we recommend tracking top-ups and withdrawals separately:
- Withdrawals — revenue for the service provided. Based on this metric, it is possible to make forecasts for future periods, identify seasonality and determine solvent regions.
- Top-ups — the potential that does not require attracting new customers and on which the business can rely if it motivates users to spend this money.
If we consider the payment metrics in more detail, it is necessary to distinguish between withdrawals with real money and withdrawals with bonuses. In most kicksharing services, there are referral programs where customers earn points for active service usage, proper parking, etc., which they can spend on future trips.
It is important to separate bonus withdrawals from cash withdrawals to see the company’s actual profit. After all, points cannot be used to pay contractors or purchase new scooters for the fleet. At the same time, bonuses need to be tracked as marketing investments that help retain active users and attract new ones.
For example, ScootAPI clients can see not only bonus withdrawals but also the balance of points in users’ wallets in the Analytics section, helping to track the company’s marketing investments.
Users metrics
Before tracking user metrics, it is important to define a definition — who is the user for your business. Someone counts the number of users by downloaded applications, someone — by 1 completed trip. We recommend that you consider someone who not only installed the application, but also registered in it as a user.
Once you’ve defined who your user is, you can segment them into groups:
- Users who registered in the app.
- Users who topped up their wallet.
- Users who completed a trip.
Data on user segments over a specific period of time will help track busy and quiet seasons, prepare for peak periods in advance, and devise a strategy to engage the audience during unpopular months.
Of course, these aren’t the only segments you can track. For example, you can distinguish between active and “sleeping” users and develop separate marketing campaigns for each audience segment to engage them with the service. For more details on user segments in the carsharing business, read the article.
In addition to user segmentation, we recommend analyzing their engagement with your product. To understand your audience, you can track metrics such as:
- Customer Lifetime (LT) — the amount of time a user spends using the service. This metric is calculated in days, months or years using the formula: LT = Date of the user’s last activity – Date of registration. For example, if a customer registered on January 1, 2022, and was last active on January 1, 2023, their lifetime in the service would be 1 year.
- Customer Lifetime Value (LTV) — how much money a user brings to the service during their lifetime. To calculate LTV, multiply the average revenue per customer for the selected period by the average duration of time the customer remains an active user of the service.
In addition to LT and LTV, for analyzing customer engagement with your product, you can determine the number of trips per user within a certain period of time. This metric helps identify loyal users who should be retained.
Vehicles metrics
Vehicles, or electric scooters, are the foundation of any kicksharing business. They are the tools that help companies earn money, so it is crucial to analyze unique transportation metrics specific to carsharing.
First of all, it is important to track quantitative metrics:
- Number of electric scooters in the fleet.
- Number of operational scooters.
- Number of scooters available for rental, etc.
In addition to quantitative metrics, it’s essential to calculate average metrics:
- Average time a scooter is in use per day.
- Average time a scooter spends waiting for rental.
- Average time a scooter is rented out, etc.
One metric that deserves special attention is the average revenue per scooter. This figure can be used to judge the payback of devices, and therefore the business as a whole. In addition, this metric provides an understanding of how much you could potentially lose if one scooter is out of commission for even a day, or how much you could potentially earn by adding one scooter to the fleet.
Trips metrics
Trip metrics are another set of unique and important indicators for the kicksharing business. By analyzing these metrics, you can identify new growth opportunities and positively impact the company’s profitability. Essentially, trips represent the revenue of the company, as users pay for them to the business.
In this category of metrics, it’s important to monitor:
- Average trip value.
- Volume of trips per device.
- Average trip duration.
- Trip frequency per user within a time period (day, week, month).
- Overall dynamics of trips and the number of trips per day, month.
In addition to the total number of trips, you can explore the percentage of successful trips. The criteria for a successful trip are defined individually by each kicksharing business. For example, it could be a trip lasting at least 2 minutes or covering a distance of at least 1 kilometer. A deeper analysis allows you to see the proportion of successful trips that generate real profit for the company and try to reduce the percentage of unsuccessful ones, where users reserve transportation but do not complete the trip.
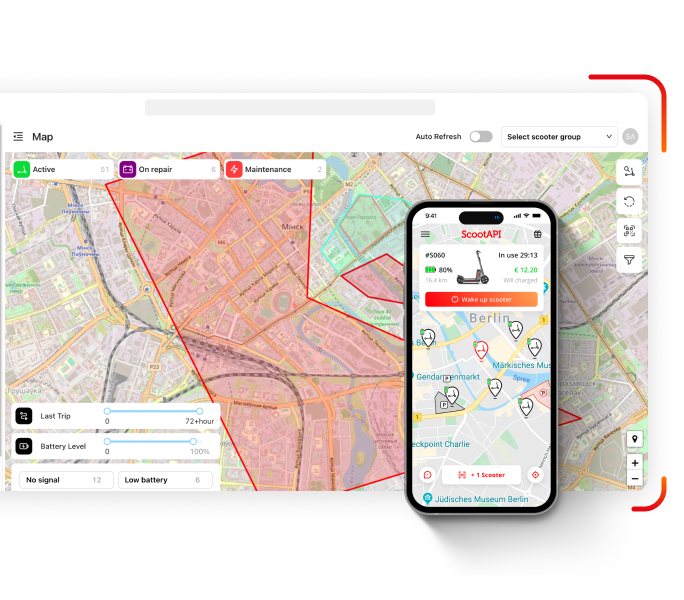
Analyzing trip metrics is important for the kicksharing business because it helps identify correlations with other metrics and influence them. For example, in the ScootAPI admin panel, we are already implementing a feature that, based on trip data, shows the most popular times for scooter usage. This data helps owners prepare for peak hours. Additionally, determining popular locations in the city where people frequently pick up and drop off scooters can be done using heatmaps.
Summing up the trip metrics it is important to say that these are exactly the indicators that can be influenced. For example, to stimulate trips with the help of various promotions and marketing tools, to correctly place scooters around the city using the same heatmap in order to increase the number of trips, and therefore the company’s profit.
_____________________________________________
In this article, we’ve listed the basic metrics that are essential to track in the sharing business. Once you’ve implemented these indicators, you can further detail the metrics for an even deeper understanding of the business.
All the necessary metrics for kicksharing and even more have already been implemented in the admin panel of the ScootAPI application. Visit our page and download a free demo version to test all the advantages of our analytics.
If you have any questions, feel free to submit a request for a free consultation. Start your journey with ScootAPI today!