As you can’t go far without a battery, you can’t go anywhere without sharing business analytics. What can our analytics module do? Let’s find out.
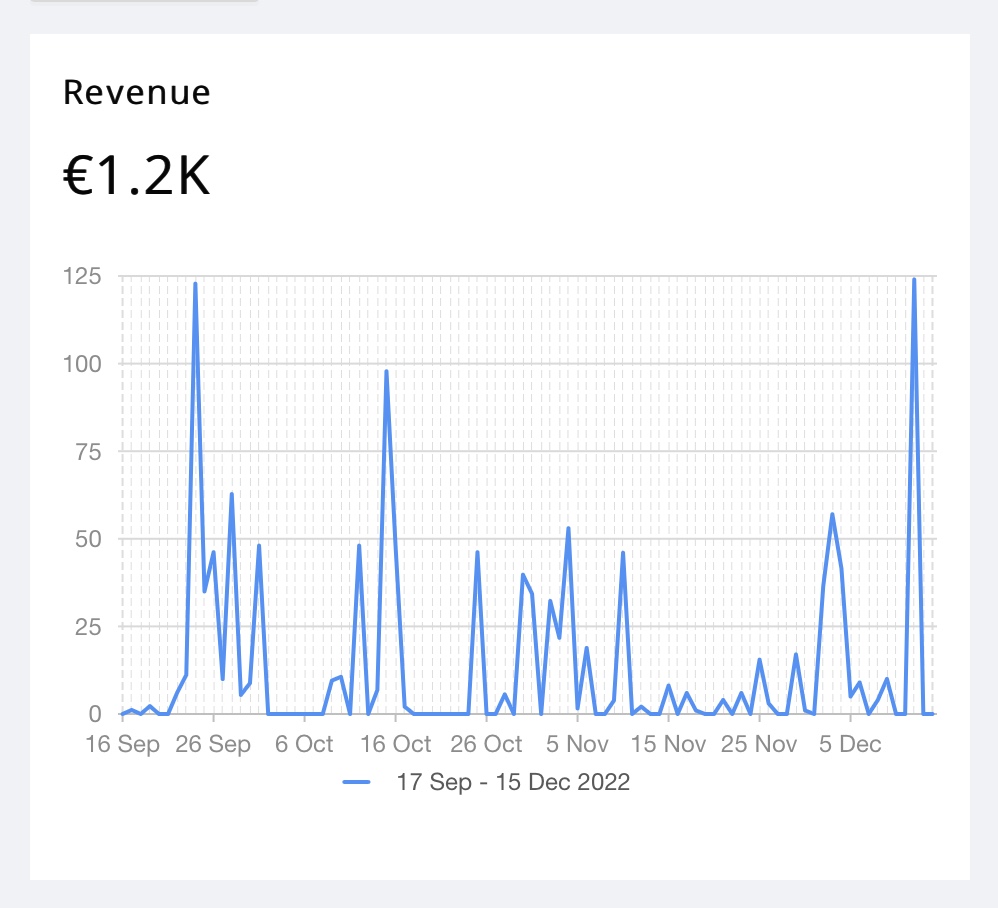
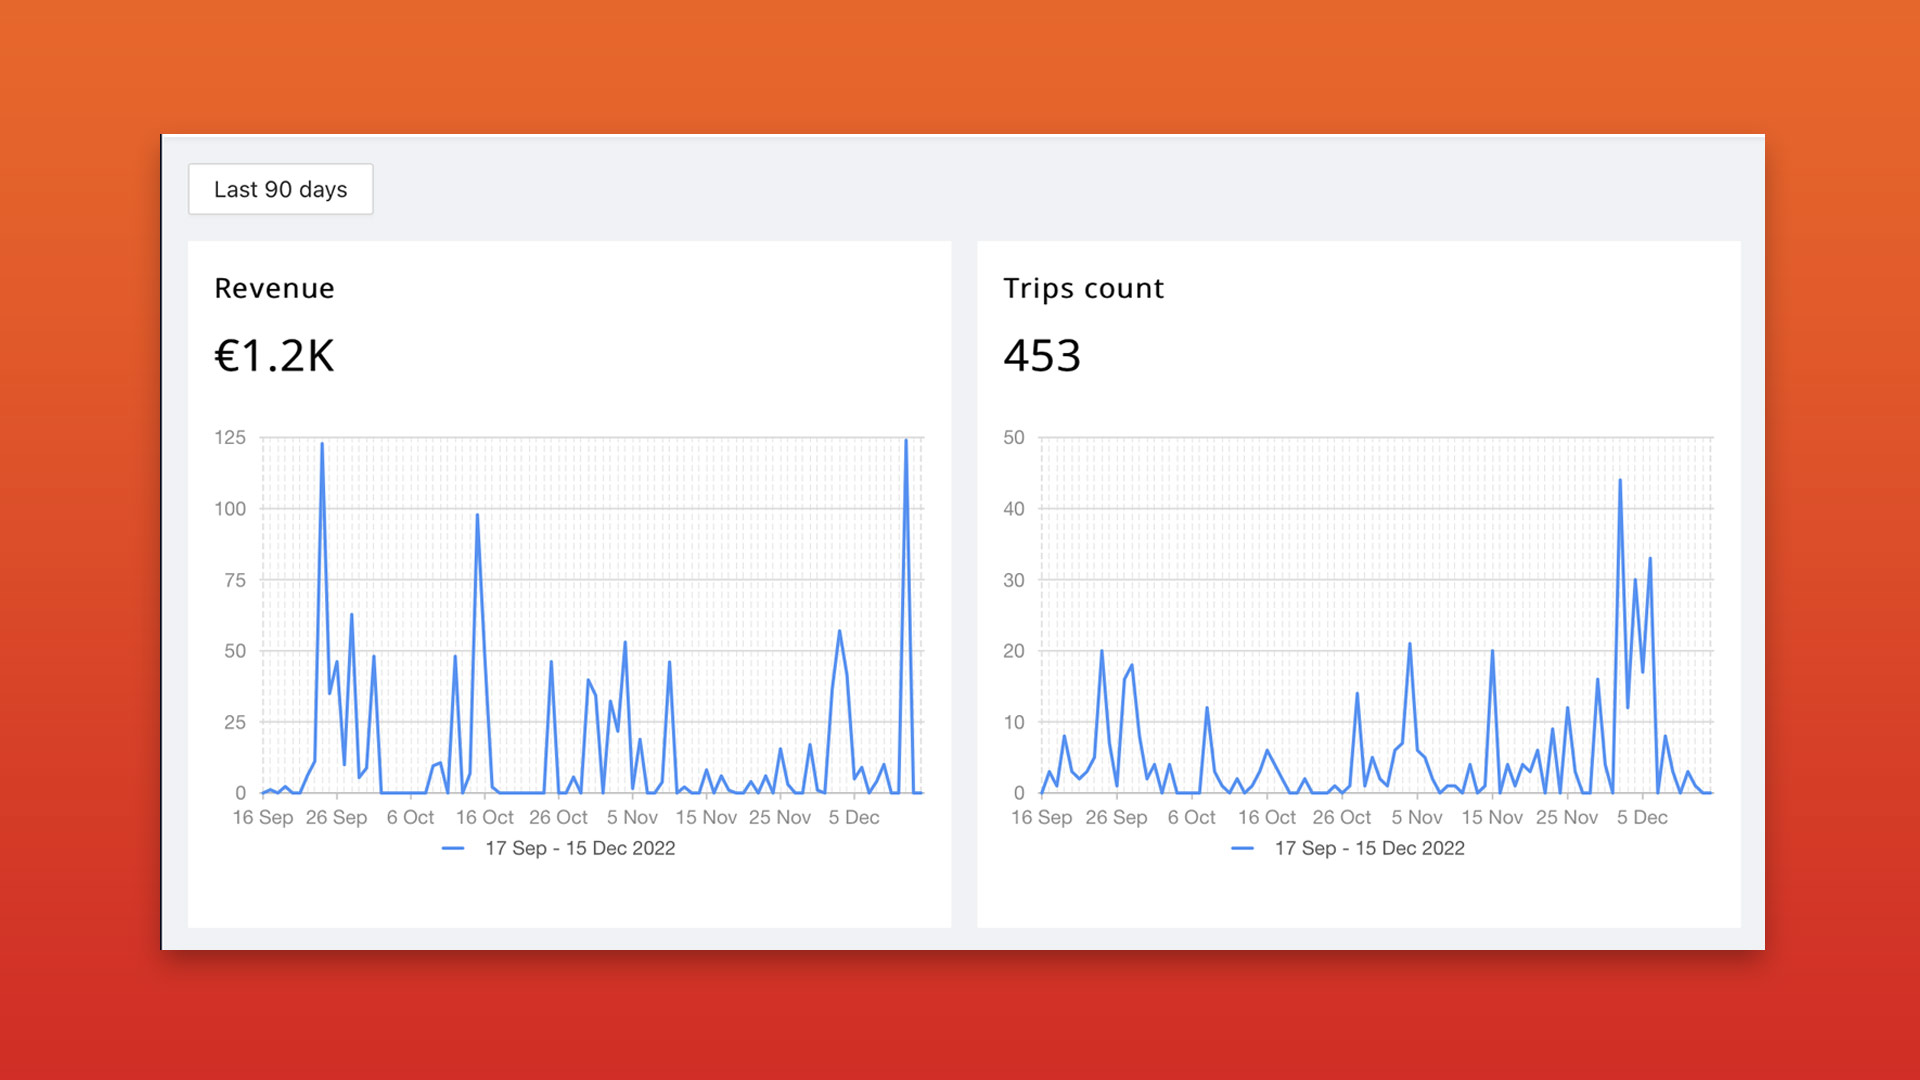
Profit
Track your business income in real-time, determine on a diagram what it depends on and adjust your approach. Observe trends and analyze growth. Collect your success formula into sharing business.
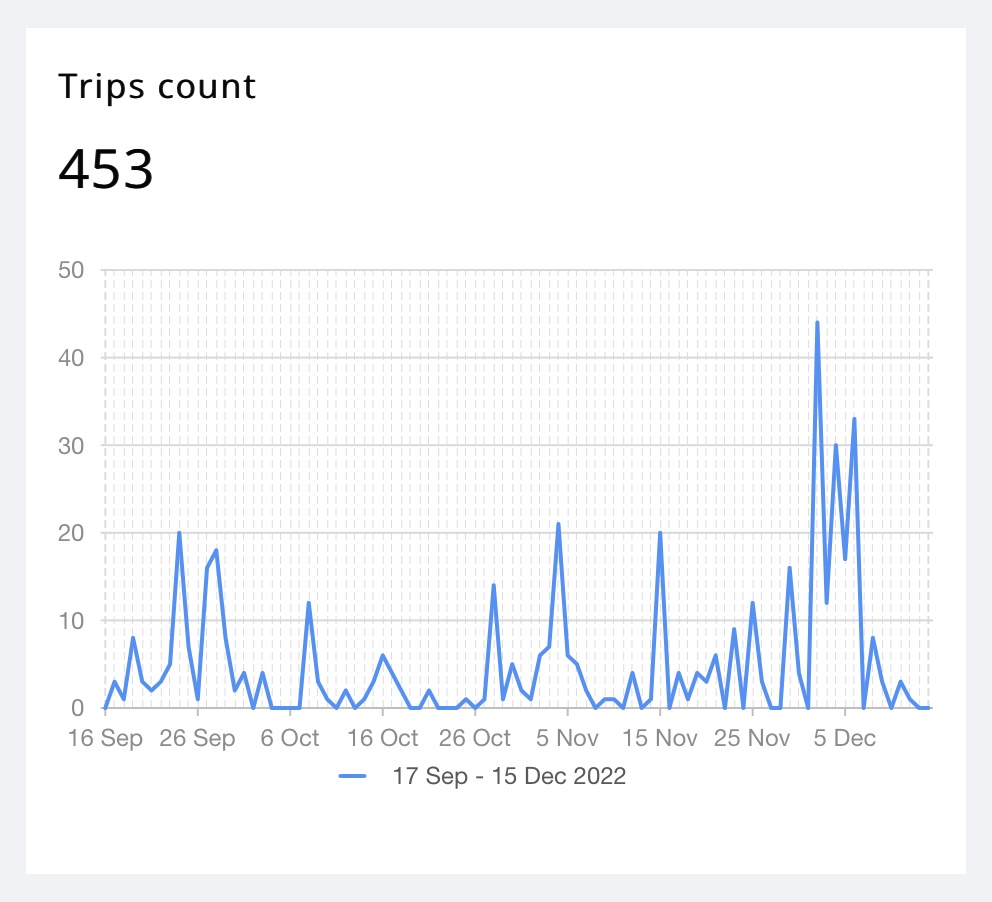
Number of trips
It follows how the number of trips increases, and they are affected by your fares, events, and promotions. Compare trips with previous periods and conclude.
This chart is a great way to see when your transportation is being used more often, and you will be ready for it.
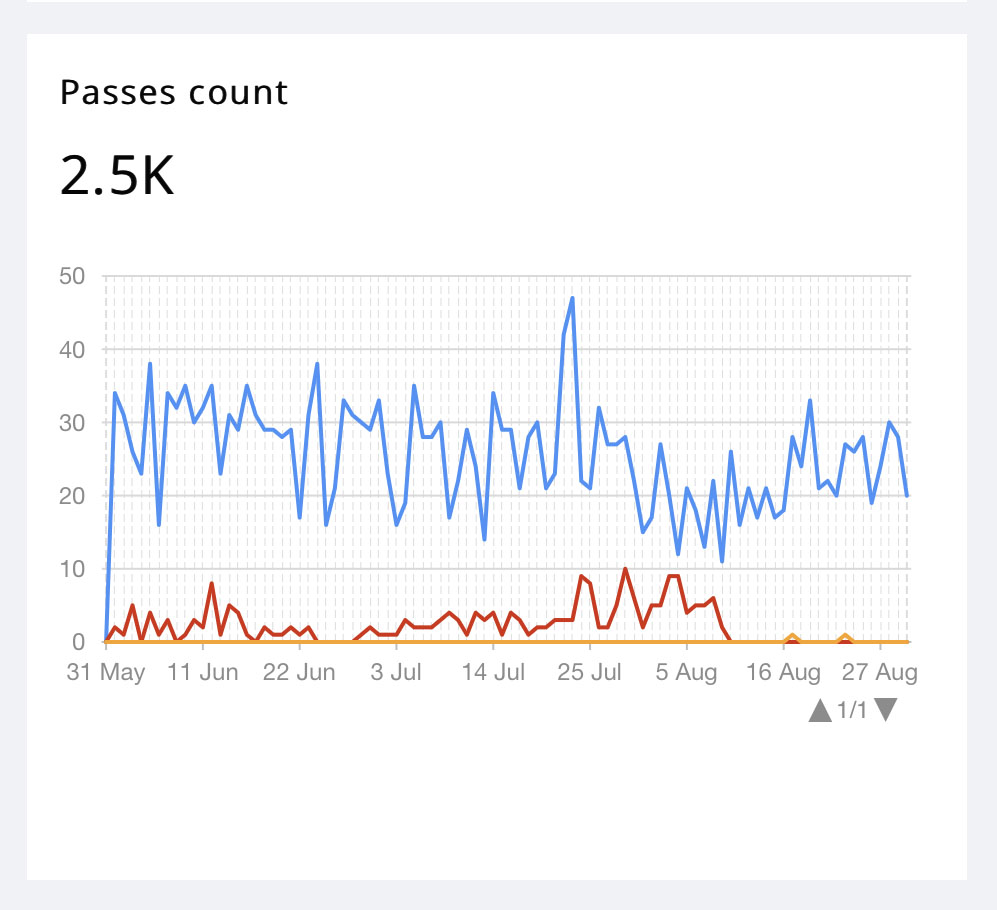
Number of subscriptions purchased
Track how your promotional activity and offer affect the number of subscriptions. You can find out which subscription is purchased more than the other.
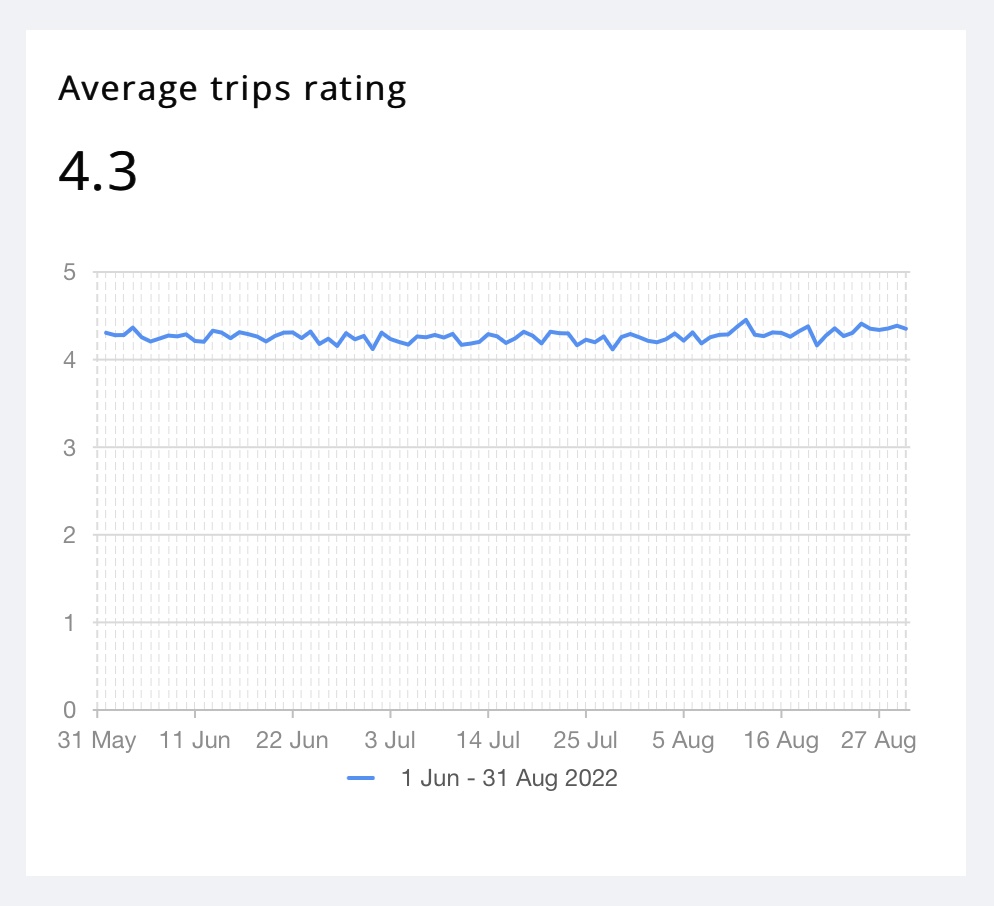
User rating
You can find out how user sentiment changes when you change rates.
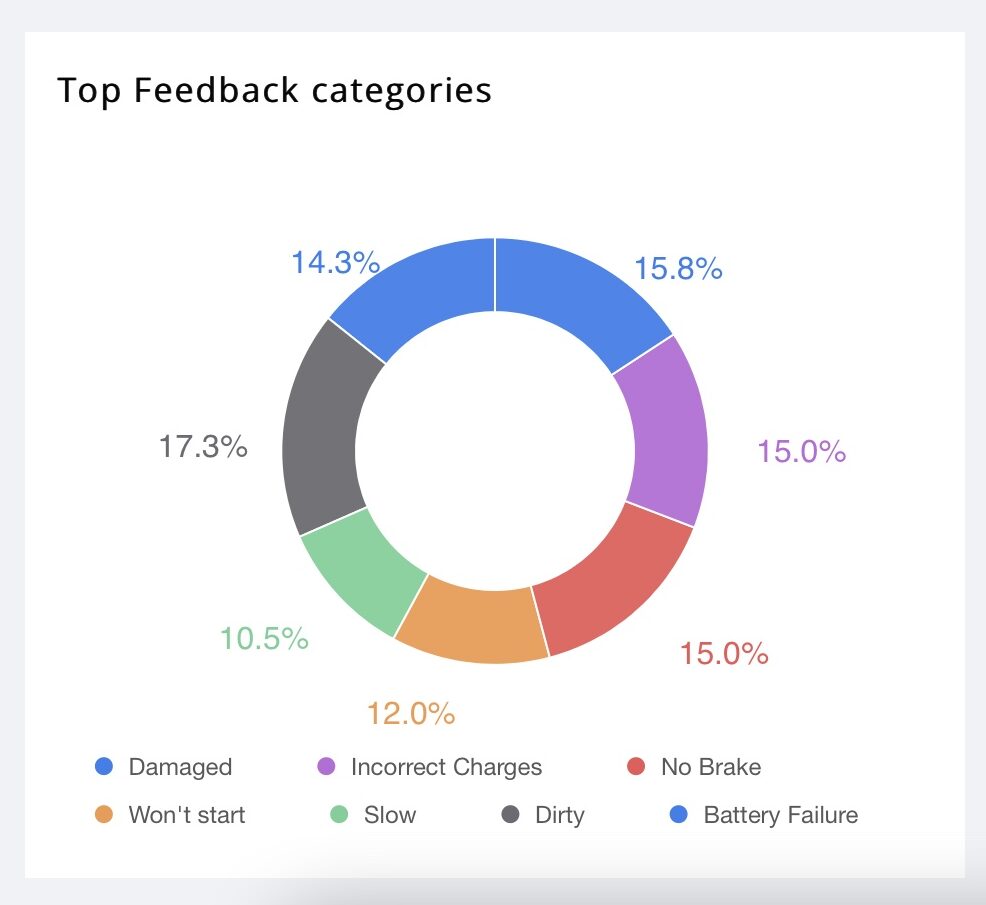
User rating categories
The indicator for those who care about their customers and also want to understand the condition of their fleet.
Number of vehicles with trips
This parameter helps to understand the correct location of scooters in the city, and whether you need to add even more vehicles to the park.

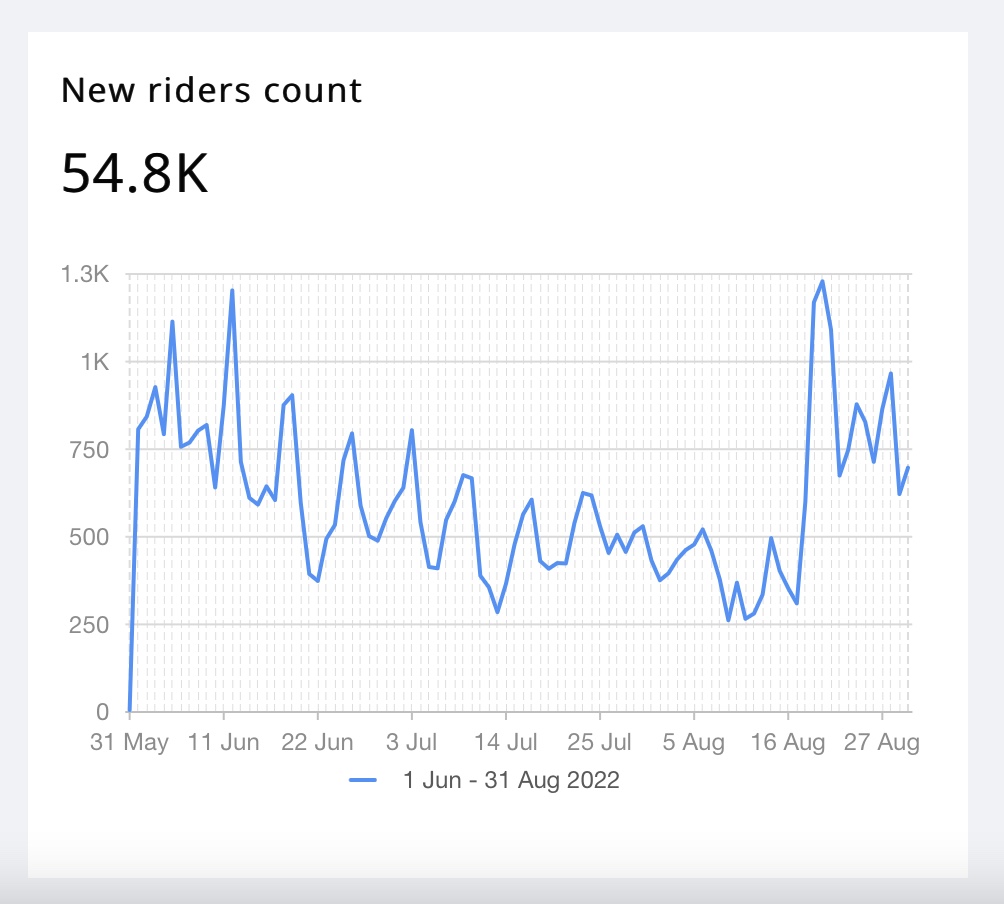
Number of new users of sharing
The characteristic that perfectly shows your marketing activity.
This is not all that our analytics can do. Contact us and we will give you a complete overview of our sharing platform.